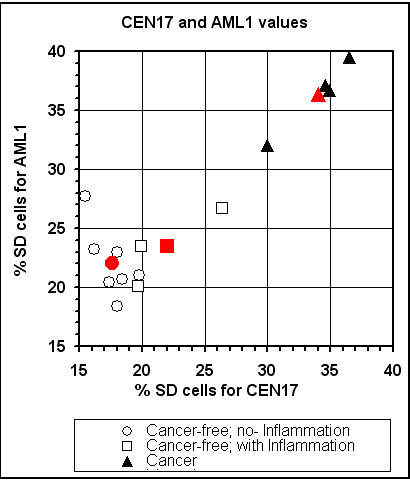
Figure 6.

Distribution of lymphocyte samples of patients with prostate cancer and cancer-free individuals, with and without inflammation of the prostate gland, according to their AML1 and CEN17 SD values. The red marked characters indicate the mean values of the corresponding subgroup; Note, that the SD values of samples derived from the cancer-free patients with chronic inflammation were similar to those of the cancer-free patients with no inflammation, and were lower than those found in the cancer patients.
