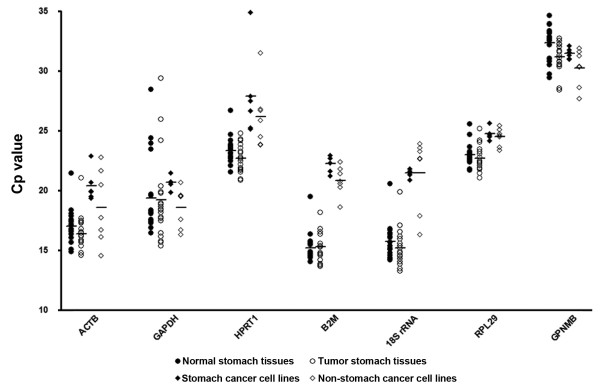
Figure 1.
Expression levels for six candidate reference genes detected by RT-qPCR. Crossing point (Cp) values in 'stomach cancer cell lines' and 'non-stomach cancer cell lines', 'normal stomach tissues' and 'tumor stomach tissues' are represented as expression level. Horizontal bar in the middle of scattered spots indicates average expression level. The lower the Cp value, the higher is the expression of genes.

