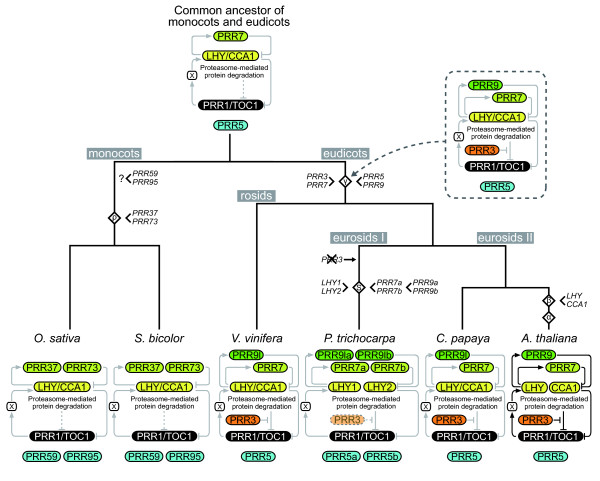
Figure 8.
Proposed schematic diagram of the evolutionary process of the plant circadian clock system. For the plant clock system model, loop I and III are described in this diagram. Diamonds with characters indicate angiosperm polyploidy event (α, β, γ, salicoid and ρ). The salicoid polyploidy event is shown as the diamond with the initial letter of salicoid (S).

