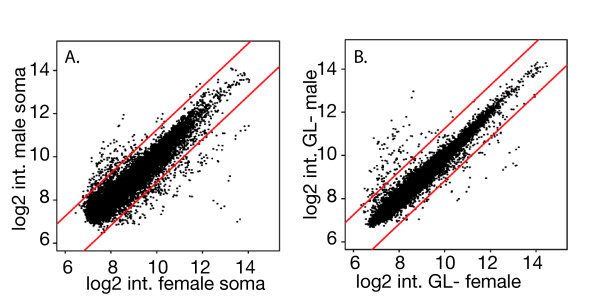
Figure 1.
Log2 intensity (int.) scatterplots show microarray profiles. A. y1w67c germline-conditioned male vs female soma and B. germline-naïve male vs female whole fly progeny of homozygous tud1 mothers. Elements above and below the red lines indicate differential expression ratios greater than two-fold. Comparison of the two scatterplots shows a reduced number of sex-biased differentially expressed genes in the germline-naive samples.

