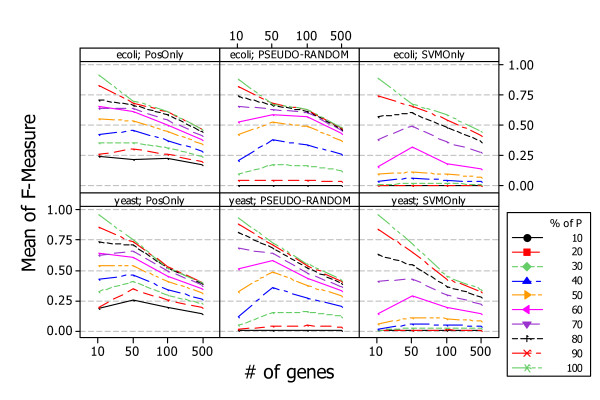
Figure 10.
Average F-Measure of PosOnly, PSEUDO-RANDOM, and SVMOnly on simulated data and at different network sizes. The figure shows the performance of PosOnly, PSEUDO-RANDOM, and SVMOnly obtained with network of different sizes. Each approaches exhibit similar behavior when the number of genes increases: the average performance of the classifier increases when the percentages of known positives is low, while decreases when the percentages of known positives is high.

