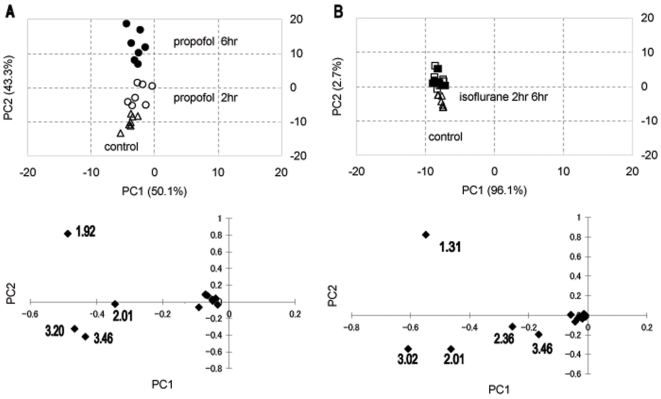
Figure 4. PCA score plot of hydrophilic brain extracts.
Each mark represents the metabolic data set from an individual rat. (A) Control (▵), propofol 2 h (○), and propofol 6 h (•). (B) Control (▵), isoflurane 2 h (□) and isoflurane 6 h (▪). Variables (n = 1\educed from 177). The lower graphs are PC loading plots of individual data sets to distinguish single putative NMR peaks responsible for the clustering pattern observed in the PCA score plot.

