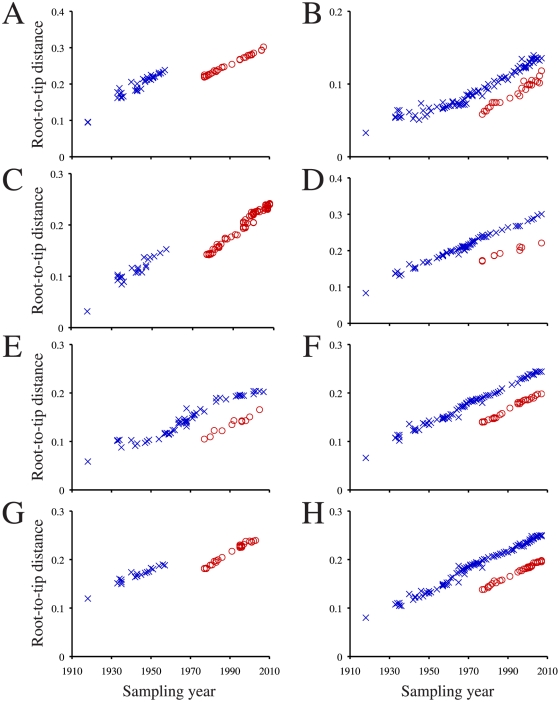
Figure 2. Root-to-tip genetic distance versus sampling year for human influenza virus segments.
(A) HA, (B) M, (C), NA, (D) NP, (E), NS, (F) PA, (G) PB1, and (H) PB2 segments are shown. Pre-1977 H1N1, H2N2, H3N2 isolates are indicated with blue Xs, and re-emergent H1N1 isolates are indicated with red Os.

