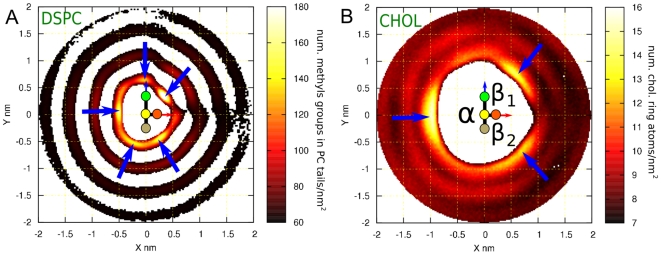
Figure 3. In-plane distribution of lipids and cholesterols around cholesterols in DSPC bilayer with 20 mol% Chol.
Two-dimensional density distributions for (A) DSPC acyl chains and (B) Chol molecules around a tagged Chol. Data shown is for DSPC bilayer with 20 mol% Chol. Each plot shows a schematic representation of the tagged cholesterol as described in Figure 1. The different faces of cholesterol can be distinguished in both panels: the smooth α-face corresponds to the region x<0 and the rough β-face to x>0. The β-face is divided into two sub-faces: β1 for y>0 and β2 for y<0. Panel (A) shows the density distribution of methyl groups of both acyl chains per nm2. The first coordination shell is located around 0.5 nm from the center of the tagged molecule. The five preferred locations for PC chains are marked by the blue arrows. Cholesterol's ability to induce order is demonstrated by three additional less structured coordination shells. Panel (B) shows the density distribution of atoms in the ring of the cholesterol molecule (17 atoms per cholesterol molecule). Panel (B) also shows that cholesterols avoid the first coordination shell covered by the PC acyl chains. Instead a clear and structured second coordination shell appears. The three emerging peaks are marked with blue arrows. Each peak is on a different face (α, β1 and β2) displaying a three-fold symmetry.

