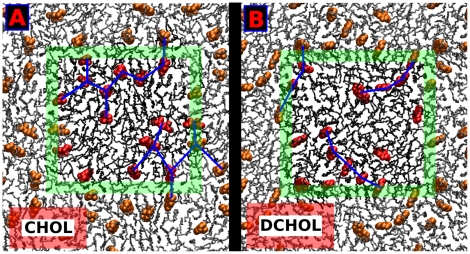
Figure 5. Configurations of Chol and Dchol molecules in the membrane.
Top view of an equilibrated configuration of (A) the DSPC/Chol bilayer and (B) the DSPC/Dchol system at 20 mol% of sterol in both cases. Only one leaflet is presented for clarity. PC molecules are shown as black sticks and sterols using space-filling representation in red color. The simulation box is shown by the green square with periodic images plotted around it. Sterols in periodic images are show in orange (instead of red as in the simulation box) and lipids in gray. Panel (A) shows triangular connections between neighboring Chol molecules. The blue lines between Chols form triangular patterns. Panel (B) displays the linear connections between Dchol molecules. This fundamental difference is due to the missing out-of-plane methyl groups in the Dchol molecule.

