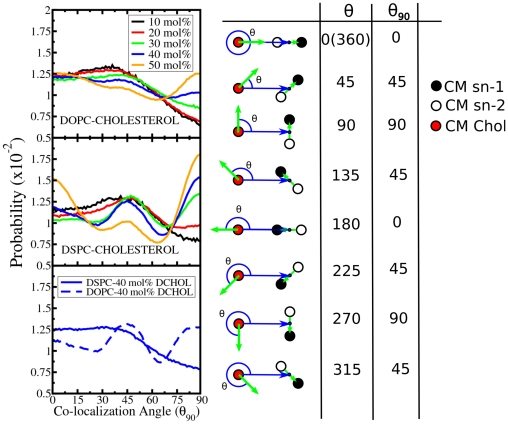
Figure 6. Lipid orientation around Chol and Dchol molecules in the second coordination shell.
Distribution profiles of the co-localization angles for all simulated systems for lipids inside the first coordination shell of Chol. Color code indicates sterol content. The graphical representation of the co-localization angle is provided next to the graphs. Green arrows denote the vector joining the centers of mass of the two acyl chains and the blues ones the vector between the center of mass of the cholesterol molecule and the mid-point of the previous vector. The red, white and black dots are the centers of masses of the sn-1 acyl chain, the sn-2 acyl chain and the Chol ring, respectively. The θ90 representation is used to represent the co-localization angle in all graphs (θ90 = 0° corresponds to collinear, θ90 = 45° to diagonal and θ90 = 90° to ‘facing’ orientations).

