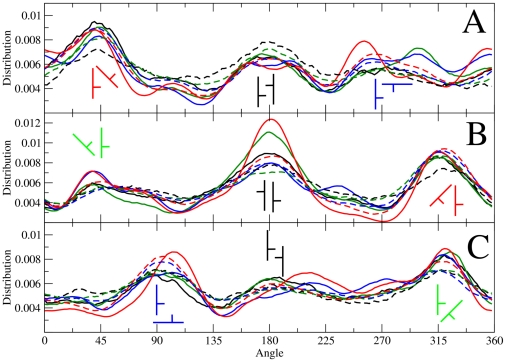
Figure 7. Cholesterol orientation around other cholesterol in the second coordination shell.
Angle distribution for cholesterol pairs corresponding to the three preferred locations displayed in the Chol-Chol 2D-density functions. The angle in the x-axis is the one formed by the C6–C11 vectors of each cholesterol molecule in the pair. All the curves in a given panel display the same qualitative behavior and here we are interested in characterizing the common trends. Panel (A) refers to the β1 peak. Panel (B) contains the data for the α peak. Panel (C) corresponds to the β2 peak. Solid lines correspond to DSPC systems whereas the dashed curves correspond to DOPC membranes. The color code indicates cholesterol content: 20 mol% (black), 30 mol% (green), 40 mol% (blue), and 50 mol% (red). Simulations with 10 mol% of Chol are not provided due to poor statistics. Preferred configurations are plotted schematically at each distribution maximum. Equivalent configurations are displayed in green, blue, and red, whereas those plotted in black are not equivalent.

