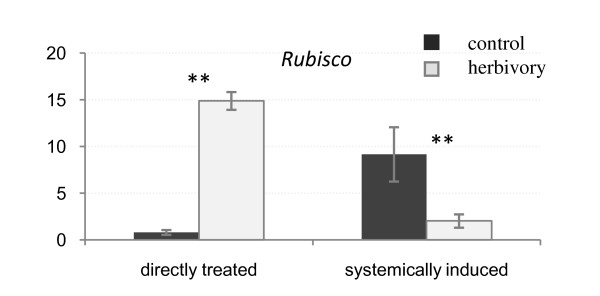
Figure 5.
Relative expression of the rubisco gene in directly treated and systemically induced Populus leaves. Leaves from the corresponding tissue of control plants were used as a calibrator. ± means SE; **p < 0.01, ***p < 0,001 according to Student's t-test. Y axis indicates the relative expression level of each gene compared to the control tissue (non-treated leaves).

