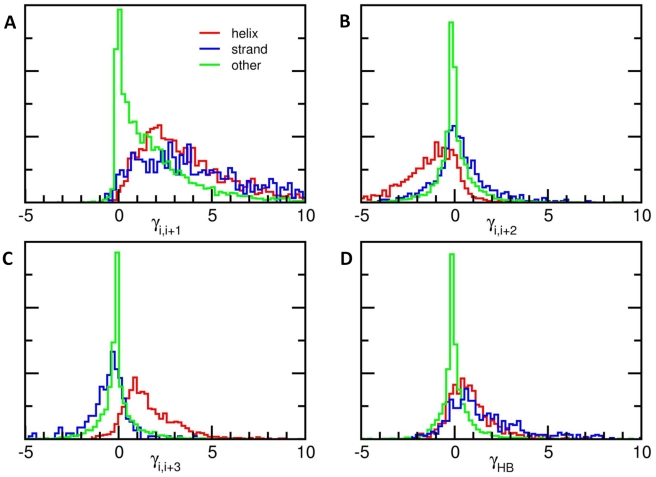
Figure 2. Force constant distributions vary with secondary structure and contact order.
Panels A, B and C, respectively, show the force constant distributions for k = 1, k = 2 and k = 3, colored by secondary structure. Red curves indicate force constants between residue pairs in which both amino acids are in α-helices (DSSP code H); blue curves are for force constants between residues in strands (DSSP codes E and B); and green curves are for all other interactions. In α-helices particularly, the k = 1 interactions are strong and positive, the k = 2 interactions are negative, and the k = 3 interactions are again strong and positive. (D) Similar histograms for hydrogen bonding partners. The red curve shows k = 4 interactions in α-helices, the blue curve shows force constants between hydrogen bonding partners in strands, and the green curve shows all other interactions for k>4.

