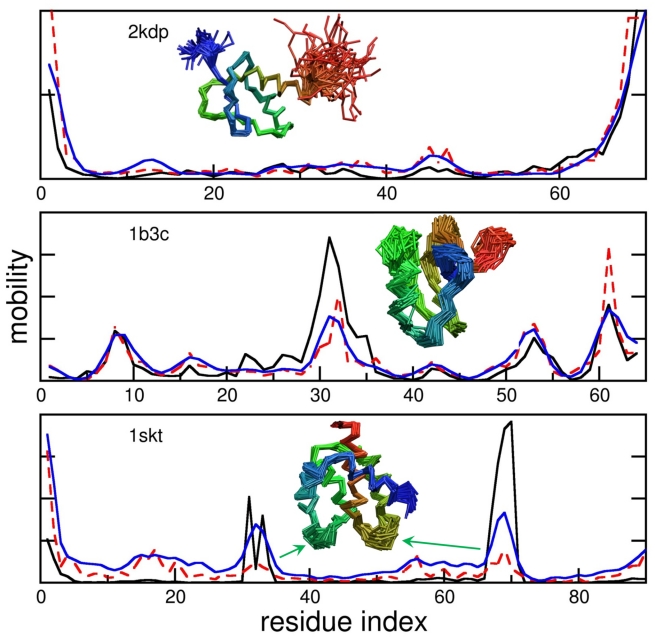
Figure 3. GNM-predicted motions display a range of overlaps with observed mobilities.
The panels display the mobility profiles for three example proteins from our test set to illustrate the various levels of agreement observed between theory and experiments. The curves are calculated from the first five modes of the covariance matrix deduced from NMR experiments (solid black lines), the five slowest GNM modes (dashed red lines) and the five slowest mGNM modes (solid blue lines). Insets are cartoons of the NMR ensembles for the three proteins, colored blue to red from the N-terminus to the C-terminus. An example of good agreement between GNM and observed covariances is the histone deacetylase complex protein 2kdp (top panel), for which the GNM accurately predicts high mobility at the termini. The correlation coefficient (cc) between theory and experiments is 0.91 in this case for both GNM and mGNM, due in large part to the motion at the protein termini. Average agreement of 0.67 is seen in the scorpion neurotoxin 1b3c, for which GNM predicts excessive motion near the C-terminus and under-predicts motion of the loop around residue 32, shown in green in inset cartoon. When mGNM is used, the sharp changes in the mobility profile are smoothed and the correlation increases to 0.79. In the calcium binding protein1skt (bottom), the GNM predicts motion at the N-terminus, whereas the NMR ensemble shows higher variation around the two turns around residues 33 and 69 (green arrows). The mGNM improves agreement by increasing mobility around these turns. The correlation between theory and experiments is increased from 0.31 to 0.57 upon adopting the mGNM instead of the GNM (with uniform force constants).

