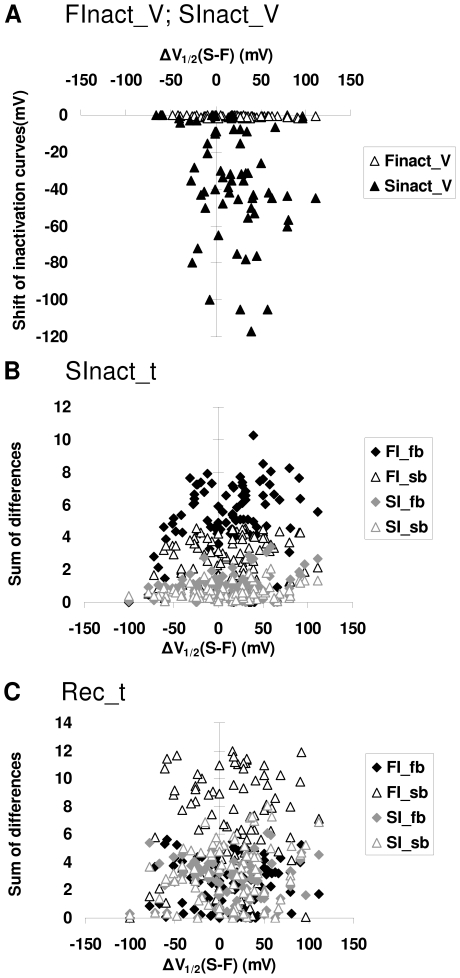
Figure 4. Results of 100 simulations with random parameters of the tetracube model.
Measures of the potency of the four prototypical “drugs” are plotted against the difference between V1/2 values for fast and slow inactivation. A, Leftward shift of the V1/2 of “FInact_V” and “SInact_V” curves, caused by “FI_sb.” B, Effect of all four “drugs” on the “SInact_t” curve. The effect was quantified by calculating the sum of differences between control and drug curves (see Figure 3C). C, Effect of all four “drugs” on the “Rec_t” curve. Sum of differences between the curves in control conditions, and during drug application. (see Figure 3D).

