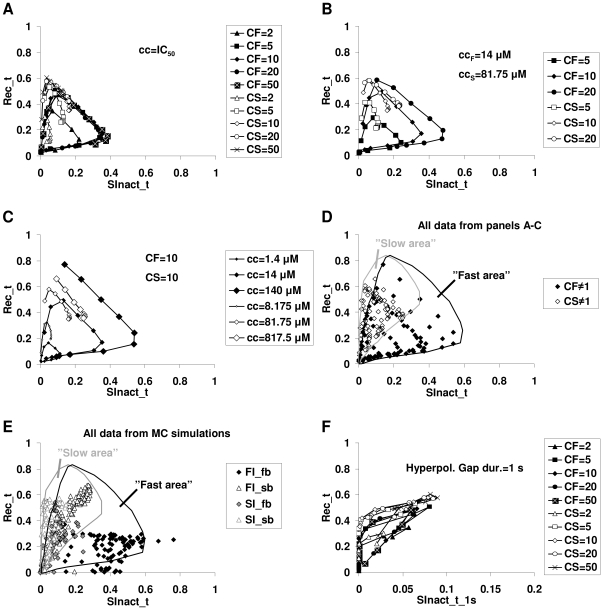
Figure 5. Different effectiveness of “FI” and “SI” drugs in two voltage protocols.
Plots of effectiveness (quantified as nSOD, as described in text) in the “Rec_t” protocol plotted against effectiveness (nSOD) in the “SInact_t” protocol for various simulated drugs. Drugs with the same state preference factor (CF or CS) and concentration are connected. A, Distribution of 100 simulated drugs with different state preference factors and binding kinetics, applied in their IC50 (−90 mV) concentration. B, The effect of different state preference factors. Simulated drugs were applied in 14 µM concentrations in the case of fast inactivation preferring, and in 81.75 µM concentrations in the case of slow inactivation preferring drugs. C, The effect of different concentrations. The state preference factor was set to 10 in case of both fast and slow inactivation preferring drugs. D, All simulated drugs plotted on one figure. The areas of fast- and slow-inactivated preferring drugs were determined using all data points simulated. E, Prototypical drugs (“FI_fb,” “FI_sb,” “SI_fb,” and “SI_sb”) simulated using the 100 channel models from the Monte Carlo simulation. The two areas were defined based on the points shown in panel D. F, Effect of increasing the hyperpolarizing gap in the “SInact_t” protocol from 10 ms to 1 s. The 100 simulated drugs from panel A were applied in their IC50 (−90 mV) concentration.

