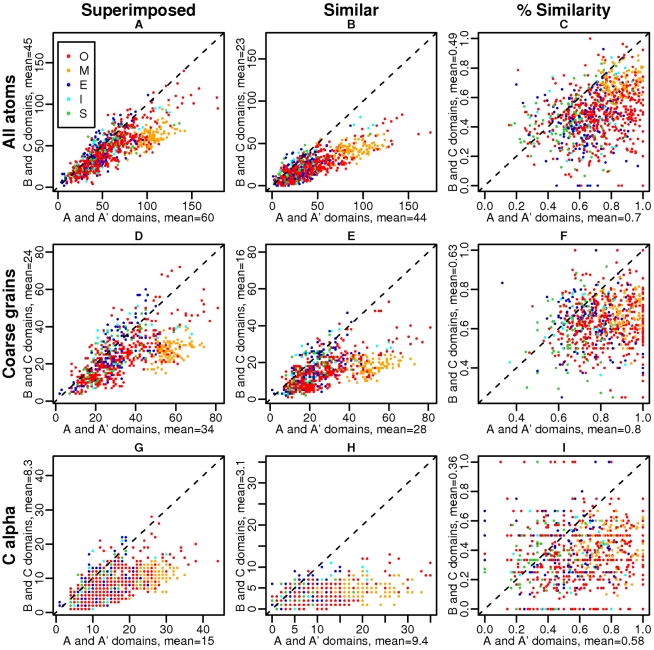
Figure 3. Similarity at protein-protein interfaces in ABAC pairs.
First row: all-atom representations, second row: coarse-grain representations, third row: C representations. First column: number of superimposed elements on A/A′ versus B/C side, second column: number of similar elements on A/A′ versus B/C side, third column: fraction of similar elements on A/A′ versus B/C side.

