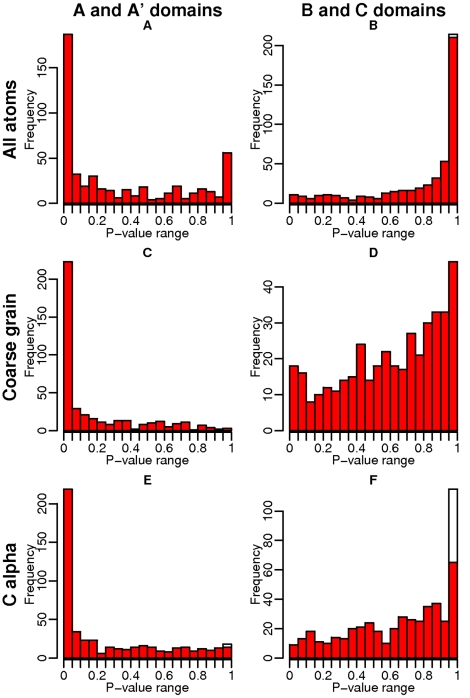
Figure 5. Distribution of similarity P-value at protein-protein interfaces of ABAC pairs of the category O.
First row: all-atom representations, second row: coarse-grain representations, third row: C representations, first column: P-values of the A/A′ domains, second column: P-values of the B/C domains. White bars correspond to a number of similar elements equal to zero, which, by definition, yields a P-value equal to 1, since the random model cannot give a number of similar residues lower than zero.

