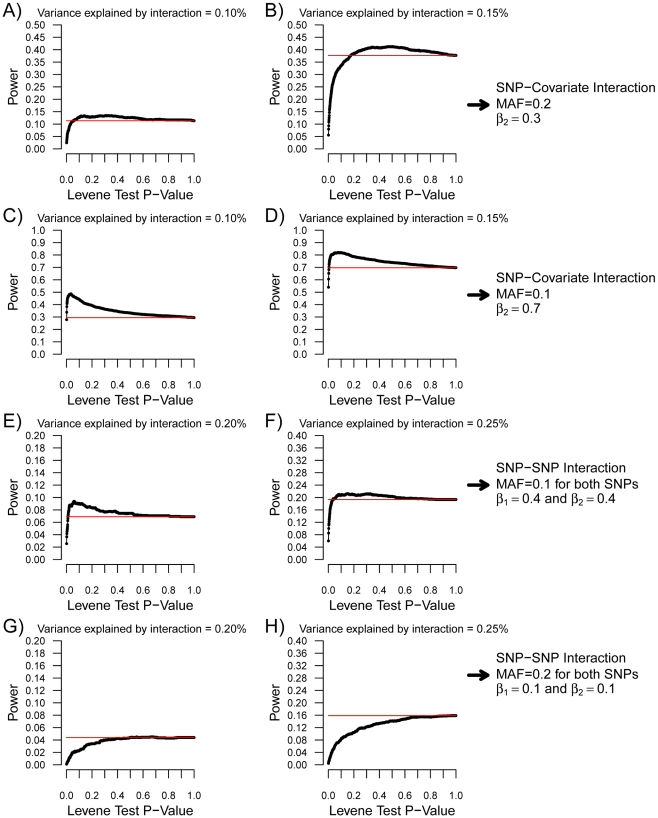
Figure 4. Power of variance prioritization as function of the Levene's test P-value prioritization threshold.
Each condition was simulated 2,000 times with 15,000 individuals. For each condition, the Levene's test P-value threshold was varied from 0 to 1 and the power of variance prioritization calculated after accounting for multiple testing (assuming 340,000 SNPs were initially tested), as illustrated by black lines. SNP-covariate interactions were simulated in (A–D). In the case of SNP-covariate interactions, all prioritized SNPs were tested for interaction with the covariate. Red lines represent the power to detect the interaction with linear regression when correcting for all 340,000 tested SNPs (P<1.5×10⁻⁷). In (A,B), the minor allele frequency was set at 0.2, the covariate-Y regression coefficient (i.e. β2) at 0.3, and β3 was chosen such that the proportion of variance explained by the interaction was 0.1% and 0.15%, respectively. These conditions match those of Figure 3B. In (C,D), the minor allele frequency was set at 0.1, the covariate-Y regression coefficient (i.e. β2) at 0.7, and β3 was chosen such that the proportion of variance explained by the interaction was 0.1% and 0.15%, respectively. These conditions match those of Figure 3D. SNP–SNP interactions were simulated in (E–H). As in Figure 5, the allelic frequency of both SNPs was set to be equal, as well as the SNP-Y regression coefficient (i.e. β1 and β2). For SNP–SNP interactions, all prioritized SNPs were tested against all SNPs (not limited to prioritized ones). Red lines represent the power to detect the interaction with linear regression when correcting for all pairwise interactions between 340,000 SNPs (P<4.3×10⁻¹³). In (E,F), the minor allele frequency was set at 0.1, the SNP-Y regression coefficient at 0.4, and β3 was chosen such that the proportion of variance explained by the interaction was 0.2% and 0.25%, respectively. These conditions match those of Figure 5A. In (G,H), the minor allele frequency was set at 0.2, the SNP-Y regression coefficient at 0.1, and β3 was chosen such that the proportion of variance explained by the interaction was 0.2% and 0.25%, respectively. These conditions match those of Figure 5B.

