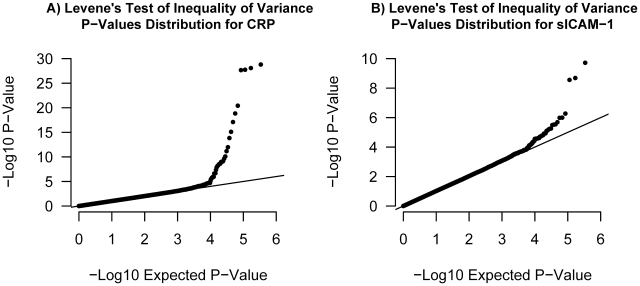
Figure 6. Quantile–quantile plots.
Illustrated in (A) is the quantile-quantile plot of Levene's test of inequality of variance P-values applied to log-CRP for 339,596 SNPs in our set of 21,799 individuals. Illustrated in (B) is the quantile-quantile plot of Levene's test P-values applied to sICAM-1 in the same set of individuals.

