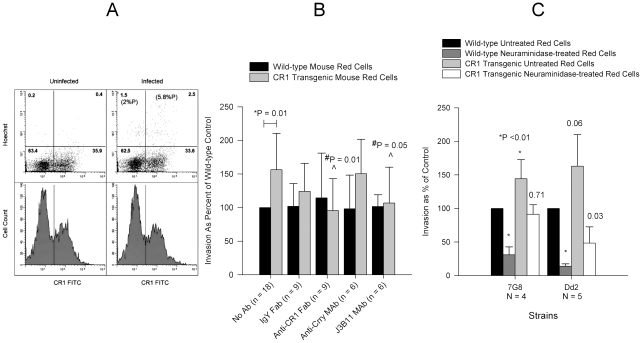
Figure 8. Invasion of wild-type and human CR1 transgenic mouse erythrocytes by P. falciparum.
(A) 7G8 invaded CR1 transgenic mouse erythrocytes preferentially in a mixed culture of wild-type and CR1 transgenic mouse erythrocytes incubated overnight with or without schizonts and analysed by flow cytometry. Upper panels show dot plots of Hoechst negative (uninfected) and positive (infected) erythrocytes. Numbers in parenthesis represent the percent parasitemia (%P). Numbers without parenthesis in each quadrant represent the percent cells from the total population. The lower panels show CR1 fluorescence histograms and the demarcation between CR1 positive (rectangle) and negative erythrocytes. (B) Effect of polyclonal and monoclonal antibodies on the invasion of wild-type and CR1 transgenic mouse erythrocytes by 7G8. Only significant P values are shown. *P is for the comparison between wild-type and CR1 transgenic red cells with no antibody. #P is for the comparison between antibody and no antibody. Invasion in wild-type erythrocytes ranged from 0.2% to 4.5%. (C) Comparison of invasion of wild-type and CR1 transgenic mouse erythrocytes between 7G8 and Dd2. Numbers above bars represent P values for the comparison to the wild-type untreated control. Invasion was measured by flow cytometry and ranged from 0.45% to 5.5% in wild-type untreated erythrocytes. All bars represent means ± standard deviations.

