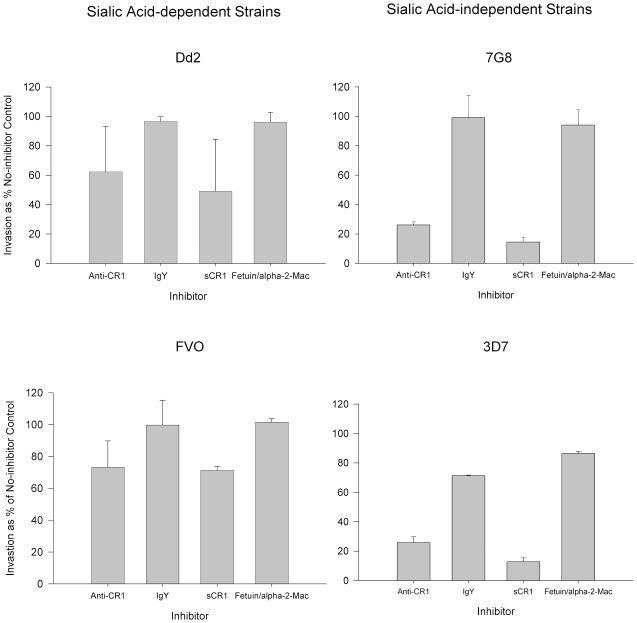
Figure 9. Inhibition of invasion of neuraminidase-treated red cells by sialic acid-dependent and independent strains.
Bars represent means ± standard deviations of the invasion as % of the no-inhibitor control. The figure represents a summary of 2–4 experiments. Parasitemias were determined by flow cytometry.

