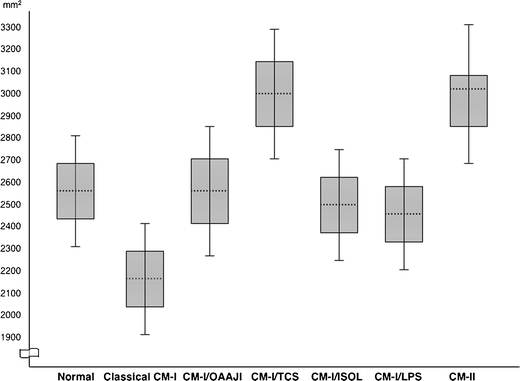
Fig. 3.

Ranges of summated inferior and superior foramen magnum outlet areas stratified by etiology. In patients with CM-I, means are shown by dotted lines, 1 SD ranges are shown by boxes, and 2SD ranges are shown by whiskers. In patients with CM-II, the median is shown by dotted line; the interquartile range is shown by box, and the maximum/minimum ranges are shown by whiskers owing to non-Gaussian distribution. Chiari subgroups with less than ten patients are not represented. Abbreviations: CM-I Chiari malformation type I, OAAJI occipitoatlantoaxial joint instability, TCS tethered cord syndrome, ISOL intracranial space-occupying lesions, LPS lumboperitoneal shunt, CM-II Chiari malformation type II
