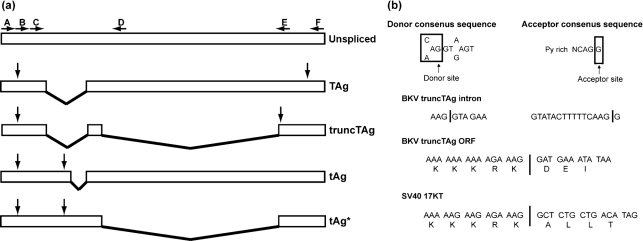
Fig. 3.
BKV early mRNA structures and truncTAg intron analysis. (a) Diagram of the four early region mRNAs produced by BKV. Boxes indicate exons and lines indicate introns. The unspliced transcript is shown, with the locations of the annealing sites for the primers (Supplementary Table S1) indicated by horizontal arrows. Vertical arrows indicate the positions of the start and stop codons for each transcript. (b) Diagram showing consensus splice donor and acceptor sequences, the DNA sequences of the splice junctions for the truncTAg second intron and the predicted codons adjoining the splice sites. The predicted codons for SV40 17KT are included for comparison.

