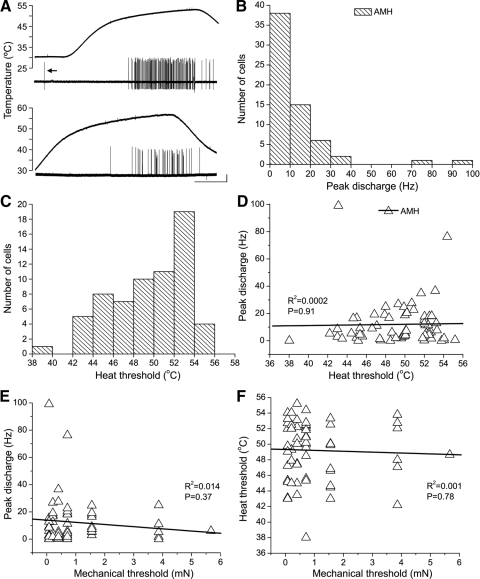
Fig. 2.
Heat sensitivity in neonatal A-mechanoheat nociceptors (AMHs). A: examples of the most vigorous responses to noxious heat observed in neonatal myelinated nociceptors, from P9 (top) and P3 (bottom) mice; both were laminae I–V nociceptors with low mechanical thresholds (0.08 mN for both); arrow (top example) shows mechanically evoked response elicited while centering heat stimulator on the RF. B: histogram showing frequency of peak discharge rates across the population of AMHs; Poisson-like distribution reveals the low probability of firing (i.e., sluggishness) to noxious heat overall. C: distribution of heat thresholds among AMHs. D: relationship between heat threshold and peak discharge rate. E: relationship between mechanical threshold and peak discharge rate; note that the highest discharge rates were seen in cells with the lowest mechanical thresholds. F: relationship between mechanical and heat thresholds among neonatal AMHs. Note lack of correlation. Calibration bar (A): 20 mV, 10 s.

