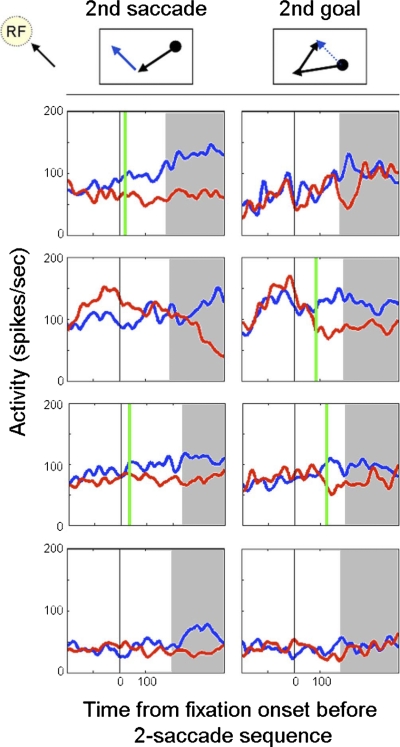
Fig. 5.
Types of 2nd saccade and 2nd goal predictive activity. We found cells that displayed 2nd saccade and/or 2nd goal predictive activity as well as cells that did neither. Left. firing rates during fixation periods in which the 2nd saccade was directed toward (blue) and away from (red) the response-field. Right. firing rates during fixation periods in which the 2nd goal was located either within (blue) or at a location opposite to the response-field (red). Black vertical line indicates the beginning of the fixation period preceding the pair of saccades. Vertical green line mark the time at which ROC analysis indicated that advanced predictive activity occurred. Time after the mean latency of the 1st saccade shaded in gray. Row 1: a cell that could predict only the 2nd saccade of a sequence but not the goal. Row 2: a cell that could only predict the 2nd goal of a sequence but not the 2nd saccade. Row 3: a cell that could predict both the 2nd saccade and the 2nd goal of a sequential pair of saccades. Row 4: a cell that did not display any advanced predictive activity.

