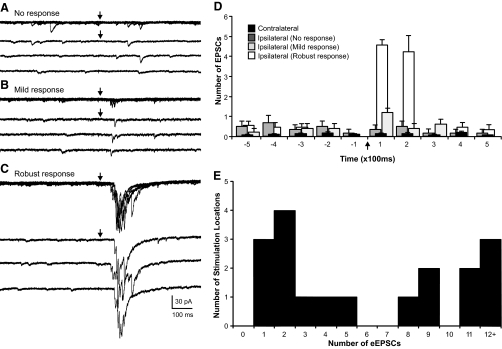
Fig. 8.
Variation in evoked EPSC (eEPSC) responses in granule cells from slices ipsilateral to the lesion. A–C: representative responses in a single neuron at 3 different stimulation locations in the granule cell layer. Each response shows 5 consecutive overlapping responses with 3 consecutive individual traces separately shown below. A: photostimulation did not evoke a response. B: a mild response of 1–2 EPSCs was consistently evoked in each of 5 trials. C: a more robust response that consisted of 5–9 eEPSCs in each of 5 trials after photostimulation at a different site in the granule cell layer. D: number of EPSCs per 100 ms before and after stimulation for each representative response in A–C. Contralateral responses are averaged across all stimulation locations in 5 neurons. →, the time of stimulation. E: frequency histogram shows the distribution of the average number of eEPSCs at 18 stimulation sites that had a positive response.

