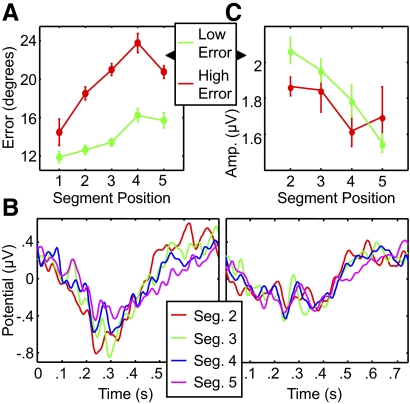
Fig. 6.
Relationship between amplitude gradient and behavioral performance. A: accuracy of the third and final imitations. Subjects were divided into 2 groups of equal size (7 subjects) based on mean orientation error: low error (green) and high error (red). B: ERPs to segments 2 to 5 in the third presentation for the better performers (left) and the worse performers (right). C: ERP amplitude (difference between positive and negative peaks) for each segment in the third presentation for each group. Error bars represent within-subject SE for each group.

