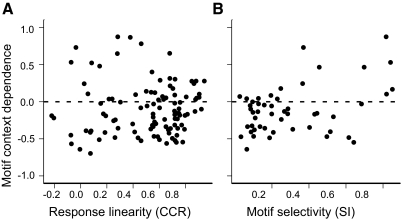
Fig. 10.
Context dependence, response linearity, and selectivity for responses to motifs. A: scatter plot showing context dependence (CD) for each motif as a function of the linearity of the response to the motif. CD compares the average excitatory response to notes in isolation against the average response to the notes in the context of the motif, ranges from −1 to 1, and is negative for suppression and positive for facilitation. Response linearity is the CCR between the response to the motif and the sum of the responses to the component notes. B: scatter plot showing median CD for each neuron as a function of its selectivity (SI).

