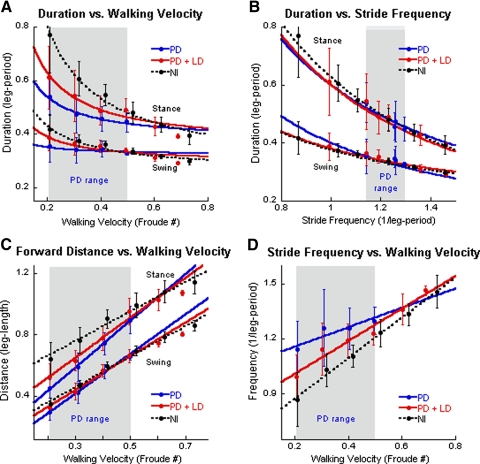
Fig. 1.
Analysis of gait as a function of walking velocity and stride frequency in Parkinson's disease (PD), PD + levodopa (LD), and in normal subjects. A: duration of stance and swing phases vs. walking velocity. In this and in subsequent figures, the blue symbols and lines represent data from PD subjects without medication, the red symbols and lines represent data from PD subjects with LD (see methods for details), and the black symbols and dotted lines represent data from normal subjects. The filled circles are means and the vertical lines ±1SD. The gray areas show the range of data from the PD subjects off LD. B: duration of stance and swing phases vs. stride frequency. C: distance covered in stance and swing phases as a function of walking velocity. D: stride frequency as a function of walking velocity. The top 3 traces represent stance phases and the bottom 3 traces represent swing phases in A–C.

