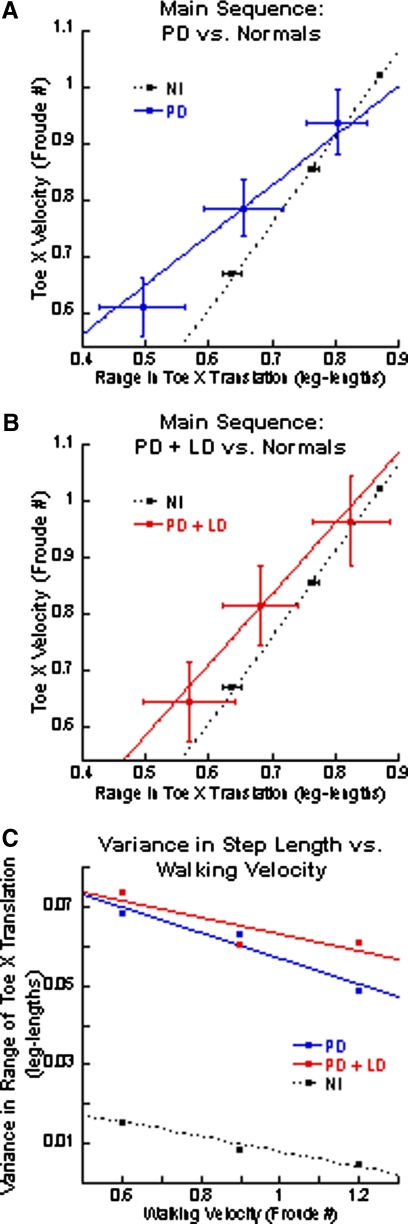
Fig. 6.
Main sequence relationship of peak forward velocity and range of Toe-X translation during the swing phases. A: the blue solid line represents the regression line for PD subjects and the black-dotted line represents the regression for normal subjects. B: the red solid line represents the regression line for PD + LD subjects and the black-dotted line represents the regression line for normal subjects. For both A and B, the horizontal and vertical lines are the SDs for the range in toe translation and velocity, respectively. C: variance of X-translation for the normal (black), PD (blue), and PD + LD (red) subjects.

