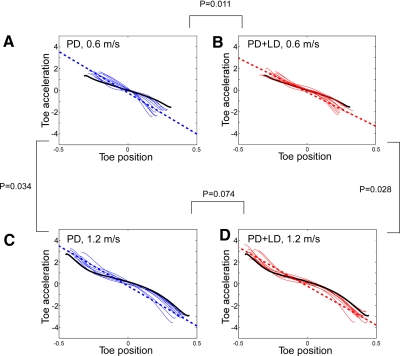
Fig. 8.
Forward toe acceleration as a function of toe position during the swing phases. The blue traces represent data from PD subjects and the red traces represent data from PD + LD subjects. The dotted lines are linear regressions of the PD and PD + LD subjects. The black traces represent the average Toe-X acceleration during the swing phase in normal subjects. A and C: data from PD subjects at 0.6 m/s (A) and 1.2 m/s (C). B and D: data from PD + LD subjects at 0.6 m/s (B) and 1.2 m/s (D).

