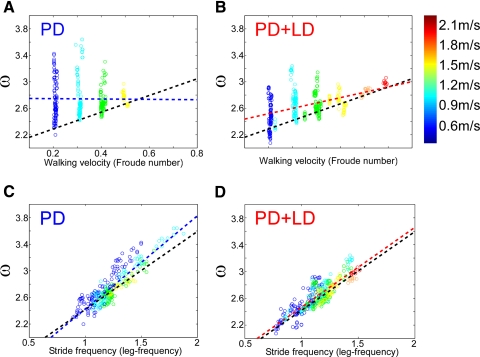
Fig. 9.
Slopes of the Toe-X acceleration (ω) vs. toe position of PD subjects as a function of treadmill velocities of 0.6 m/s (A, B) and 1.2 m/s (C, D), off (A, C, blue) and on (B, D, red) LD. The black-dotted lines are linear regressions of the relationship of normal subjects. The heavy blue and red lines are linear regressions of data from PD and PD + LD subjects, respectively. The open circles are data from individual gait cycles. The different colors represent the different walking velocities, with purple being the lowest and red being the highest walking velocities (see color bar to the right). The data on the accelerations from Fig. 8 and the slopes of the toe acceleration as a function of toe position determine the feedback control parameter for the model shown in Fig. 7 during the swing phase.

