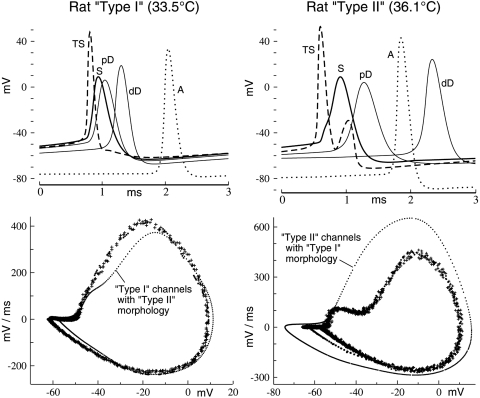
Fig. 7.
Comparison of AP initiation and propagation throughout 2 rat ganglion cell morphological models. Top panels: plots of AP initiation, shape, and time of occurrence at different RGC locations. Each set of records are of a 3-ms segment taken from the steady-state phase of model impulse trains. TS, trigger segment (site of impulse initiation); S, soma; pD, proximal dendrite (∼25% into the dendritic tree); dD, distal dendrite (near the dendritic tips); A, axon (900 μm distal to TS). Note the 2 depolarizations in the record for TS of RGC Type II (see text for interpretation). Bottom panels: phase plots of experimental impulse trains (+) of the 2 RGCs are independently fit by the model (heavier dots). The strong sensitivities to cell geometry become apparent when the distributed ion channels (model fits) are applied to the complementary RGC morphologies (small dots).

