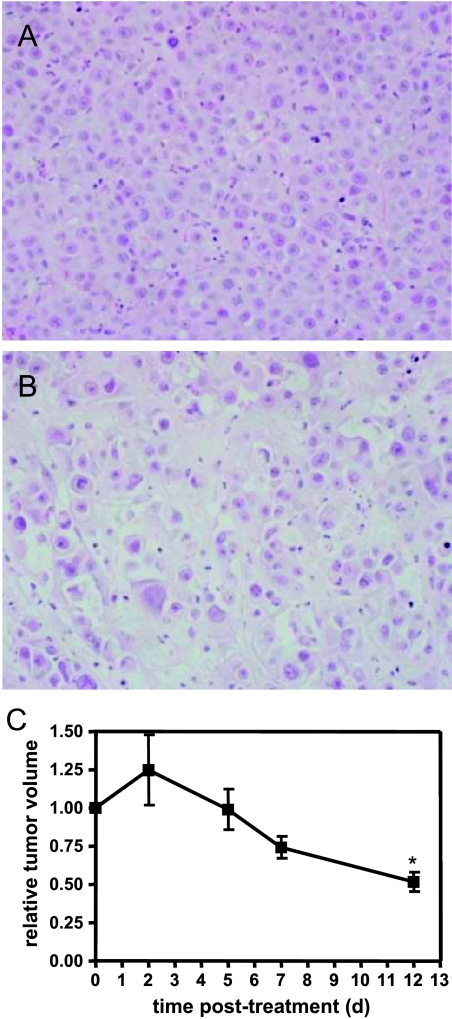
Figure 1.
Characterization of tumor response to CPA. Hematoxylin/eosin staining of a section from a control tumor (A) and a CPA-treated tumor (B). (C) Progression of tumors treated at days 0 to 6 with CPA, relative to tumor volume. Control tumors were of similar size to treated tumors at the initiation of treatment. *P < .05, compared with day 0, t test, n = 4.

