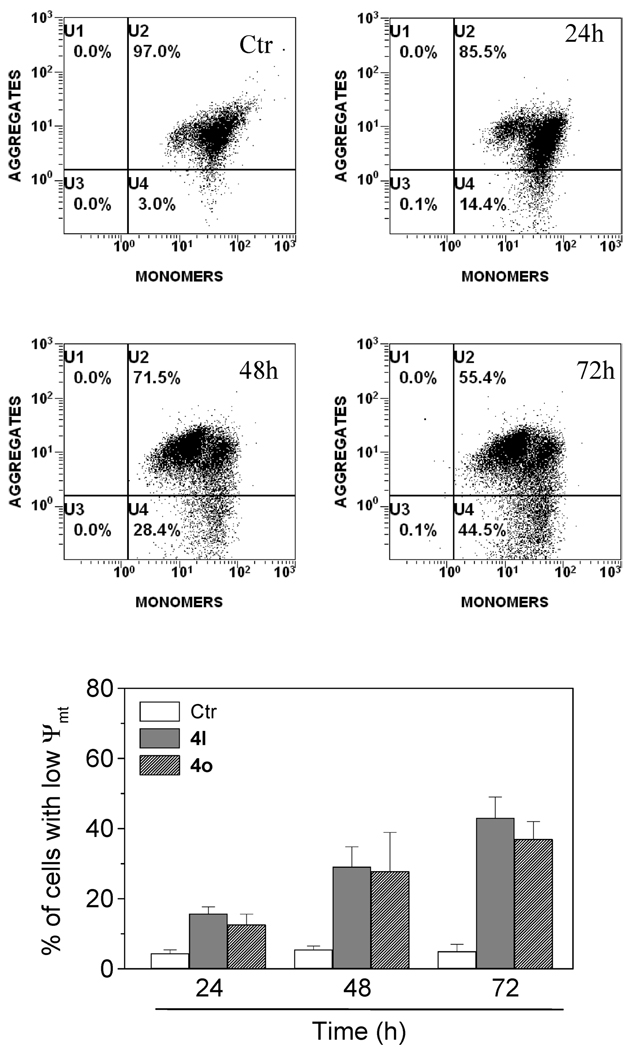
Figure 4.
Assessment of mitochondrial dysfunction after treatment with compound 4l or 4o. Upper and middle panels show representative histograms of Jurkat cells treated with 50 nM 4l for the indicated times and stained with PI and annexin-V-FITC. Lower panel shows induction of loss of mitochondrial membrane potential after 24, 48, and 72 h of incubation of Jurkat cells with 50 nM 4l or 4o. Cells were stained with the fluorescent probe JC-1 and analyzed by flow cytometry. Data are expressed as the mean ± SEM for three independent experiments.

