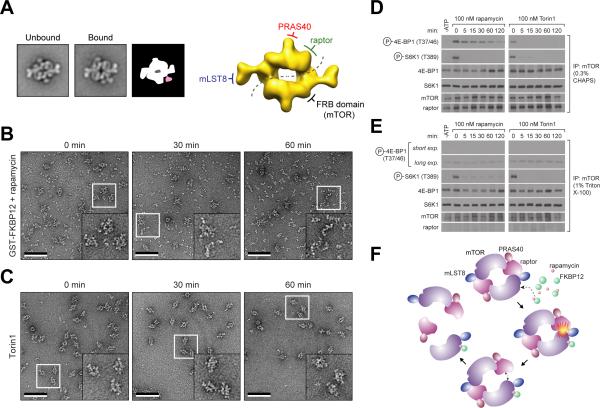
Figure 4.
Effects of rapamycin-FKBP12 on mTORC1. (A) Representative class averages of untreated mTORC1 (left) and mTORC1 treated with 50 nM of rapamycin and 0.02 μg/μl GST-FKBP12 (middle), and a schematic representation showing the additional density in pale red (right). The side length of each panel is 45 nm. To the right, the location of the FRB domain with respect to the other components in the cryo-EM map of mTORC1 is shown. (B) and (C) Purified mTORC1 was treated with 50 nM of rapamycin and 0.02 μg/μl GST-FKBP12 or 100 nM Torin1. EM images of negatively stained samples were taken at the indicated time points. The inset in each image shows an enlarged view of the area marked by the white square. The scale bars represent 100 nm. (D) and (E) mTOR immunoprecipitates, prepared in lysis buffers containing 0.3% CHAPS or 1% Triton X-100, were subjected to in vitro kinase assays using 4E-BP1 or S6K1 as a substrate in the presence of 100 nM rapamycin and 0.02 μg/μl FKBP12 or 100 nM Torin1. Assays were then analyzed by immunoblotting for the indicated proteins and phosphorylation states. (F) A model depicting a potential mechanism of mTORC1 inhibition by FKBP12-rapamycin. “see also Figure S4”

