
Figure 1.
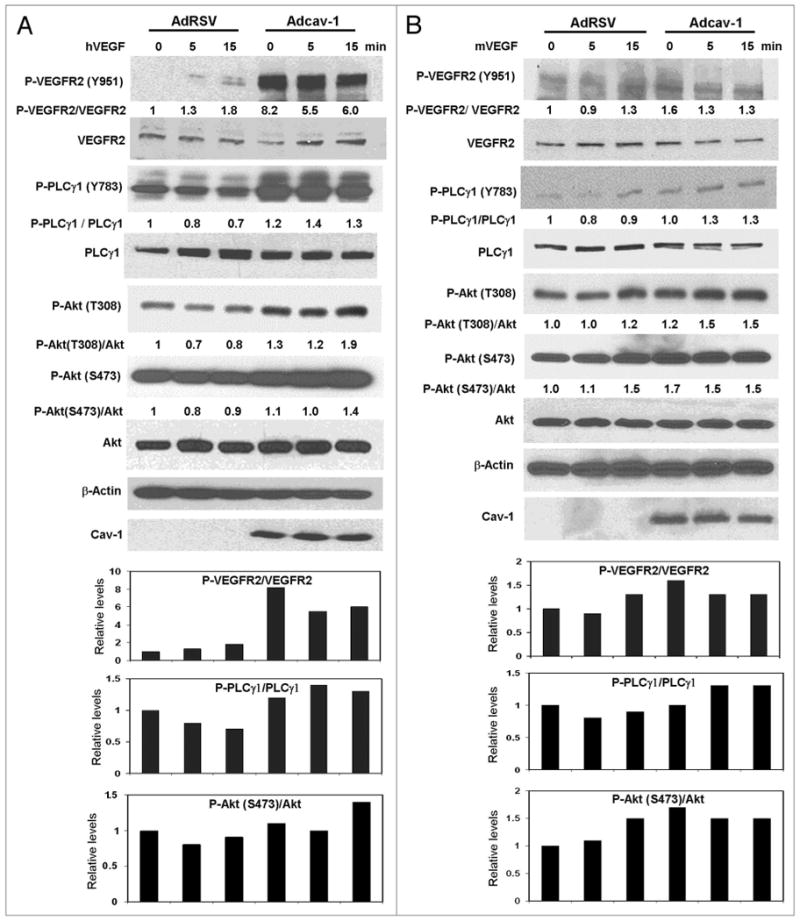

Figure 1A and B. Cav-1 stimulates the VEGF/VEGFR2 induced angiogenesis signaling pathway. (A) LP-LNCaP cells were infected with Adcav-1 or control AdRSV at an MOI of 10. Cells were incubated with SFM for 8 h, treated with hVEGF (25 ng/ml) for 0–15 min, lysed and analyzed by western blotting (B), cav-1-/- ECs were infected with Adcav-1 or control AdRSV at an MOI of 200. Cells were incubated in EBM-2 medium for 8 h, treated with mVEGF (50 ng/ml) for 0–15 min and lysed.
Figure 1C. Cav-1 stimulates the VEGF/VEGFR2 induced angiogenesis signaling pathway. (C) cav-1-/- ECs were plated overnight and incubated with 3.0 μg/ml of rcav-1 in EBM-2 for 8 h. The cells were then treated with mVEGF (50 ng/ml) for 0–15 min and lysed. In (A–C) introducing cav-1 to the cells significantly increased the phosphorylation of VEGFR2, PLCγ1 and Akt and it further stimulated their response to VEGF treatment. Blots shown (A-C) are representative of three independent experiments. Bar graphs represent densitometric data of ratio units of selected phosphorylated protein bands per total protein bands relative to that in the untreated and unstimulated controls.