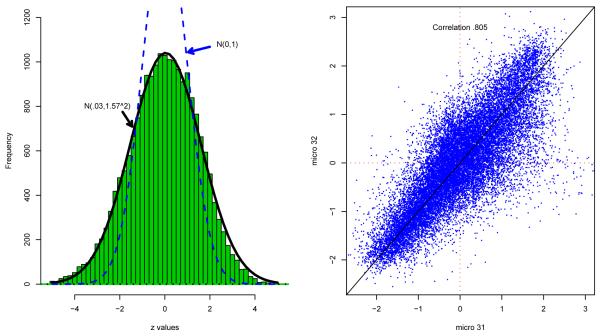
Figure 1.
Left panel: histogram of m = 20426 z-values (1.1) for Cardio study; center of histogram is much wider than N(0, 1) theoretical null. Right panel: scatterplot of microarrays 31 and 32, (xi31, xi32) for i = 1, 2, …, m, after removal of row-wise gene means; the scattergram seems to indicate substantial correlation between the two arrays.

