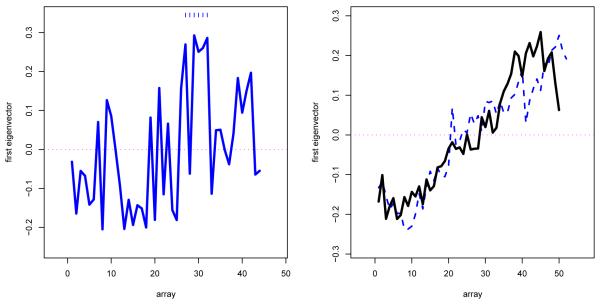
Figure 2.
Left panel: Components of first eigenvector of row sample correlation matrix for the 44 healthy Cardio subjects, plotted versus array number 1, 2, … , 44; dashes emphasize the block of large components for arrays 27–32. Right panel: First eigenvectors for healthy (solid line) and cancer (dashed) subjects, prostate cancer study, Singh, Febbo, et al. (2002); there was a systematic drift in expression levels as the study progressed.

