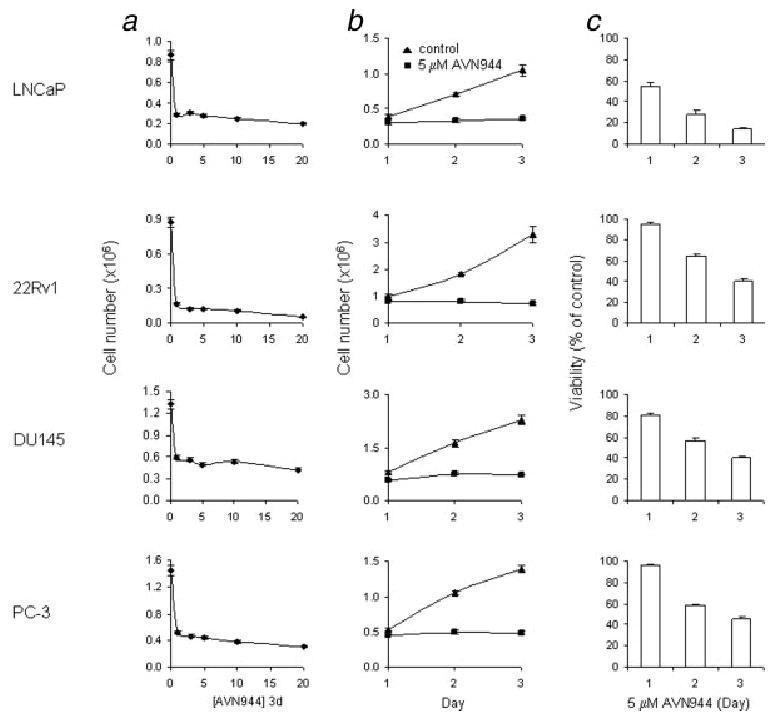
Figure 2.

Dose response, cell growth in the presence of AVN944 and AVN944-induced cytotoxicity. (a) Prostate cancer LNCaP, 22Rv1, DU145 and PC-3 cells were treated with increasing doses (in μM) of AVN944 for 3 days in triplicate. Cells were counted at the end of each treatment. Bars indicate SD. (b) Cells were plated in triplicate and treated with 5 μM AVN944 for indicated periods of time. Cells were counted at the end of each treatment interval. Bars indicate SD. (c) Cells were plated and treated as in (b). Cell viability was determined by an MTS assay. Bars indicate SD.
