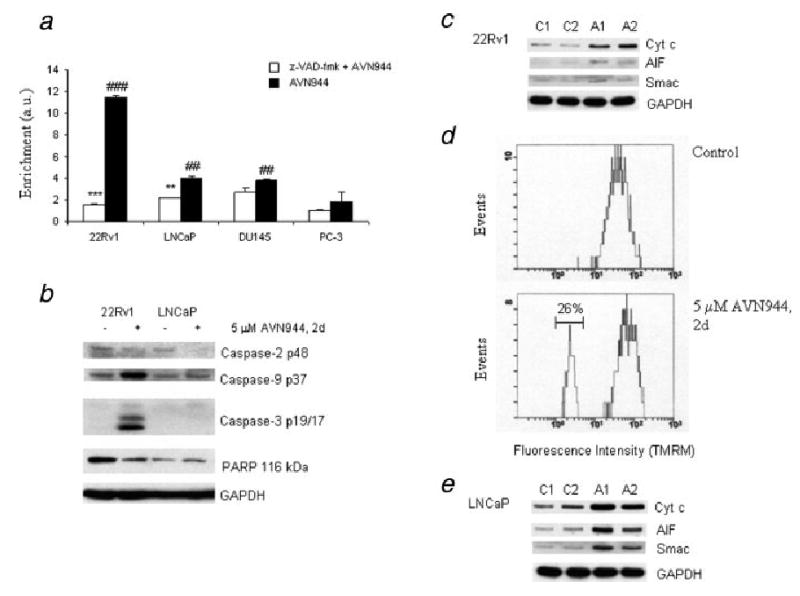
Figure 4.

AVN944-induced apoptosis in prostate cancer cells. (a) AVN944-induced apoptosis in prostate cancer cells was measured by a cell death detection ELISA kit as described in “Material and methods.” Enrichment factor (Enrichment) indicating increased content of histone-associated DNA fragments in the cytosol was calculated as a fold increase compared to mock-treated cells in cells treated with z-VAD-fmk and/or AVN944. Experiments were done in triplicate. Bars indicate SD; ***p < 0.001; **p < 0.01 (significance of z-VAD-fmk + AVN944 vs. AVN944); ###p = 0.001; ##p < 0.005 (significance of AVN944 treatment vs. mock treatment). (b) Caspase activation and PARP cleavage. Lysates from 22Rv1 and LNCaP control (−) and AVN944 (+)-treated cells were prepared to analyze activation of caspases and PARP cleavage by western blotting; GAPDH was used as the loading control. Experiments were repeated 3 times, and a representative blot is presented. (c) Mitochondrial pathway. Mock-treated and AVN944-treated 22Rv1 cells for 1 or 2 days were permeabilized with digitonin. Western blot analysis was used to detect the presence of cytochrome c, AIF and Smac in the cytosol; GAPDH was used as a loading control. C, mock-treated cells for 1 (C1) and 2 (C2) days, A, AVN944-treated cells for 1 (A1) and 2 (A2) days. (d) Depletion of mitochondrial membrane potential in 22Rv1 cells. Flow cytometry was used to determine percentage of cells with depleted mitochondrial membrane potential (region, 26%). Experiments were repeated 3 times, and a representative result is presented. (e) Release of mitochondrial proteins in LNCaP cells. LNCaP cells were treated and analyzed as described in (c).
