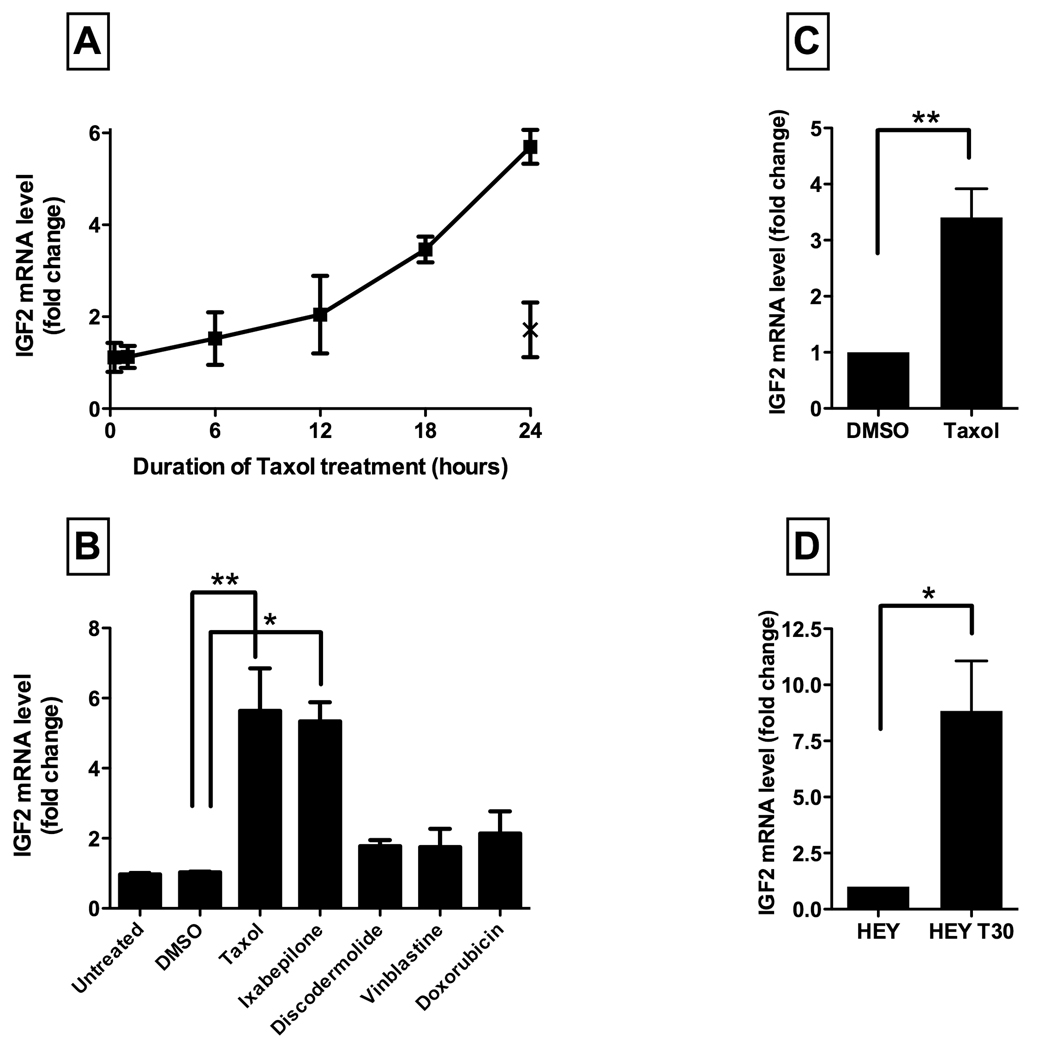
Figure 2. Taxol-induced IGF2 mRNA expression.

A. The time course of IGF2 expression following Taxol treatment (5 nmol/L) in A2780 cells is depicted with squares and a solid connecting line. The IGF2 mRNA level after Baccatin treatment (5 nmol/L) for 24 hours is also shown on the graph, marked by an X. Results shown are the mean ±SE of two independent experiments, each performed in triplicate.
B. A2780 cells were treated for 24 hours with vehicle alone (DMSO) or with cytotoxic drugs, at their equipotent molar concentrations. The IGF2 mRNA level is expressed as fold-change relative to untreated cells. Results shown are the mean ±SE of two independent experiments, each performed in triplicate.
*p<0.05; **p<0.01 (One-way ANOVA, Dunnett post-test)
C. HEY cells were treated with vehicle alone (DMSO) or Taxol 5 nmol/L for 24 hours. The IGF2 mRNA level, determined by reverse transcription quantitative real-time PCR, is expressed as fold-change relative to untreated cells in complete growth medium. Results shown are the mean ±SE of three independent experiments, each performed in triplicate. **p< 0.01 (t-test)
D. IGF2 mRNA expression in Taxol-resistant HEY-T30 cells, determined by reverse transcription quantitative real-time PCR, is expressed as fold-change relative to HEY parental cells. Results shown are the mean ±SE of three independent experiments, each performed in triplicate. *p<0.05 (t-test)
