Figure 3.


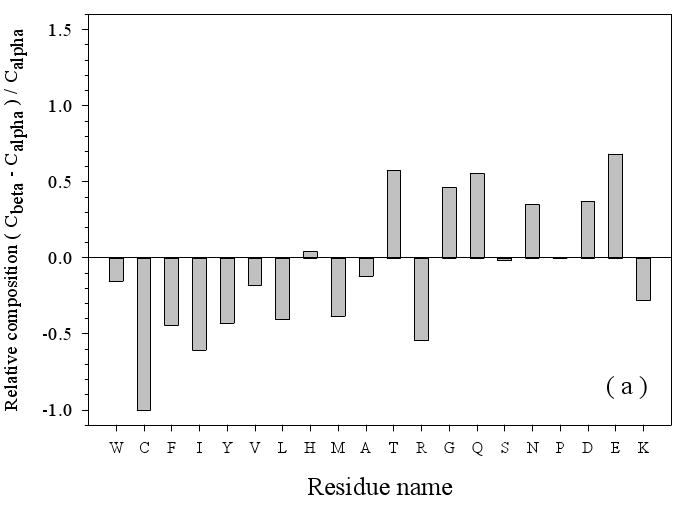
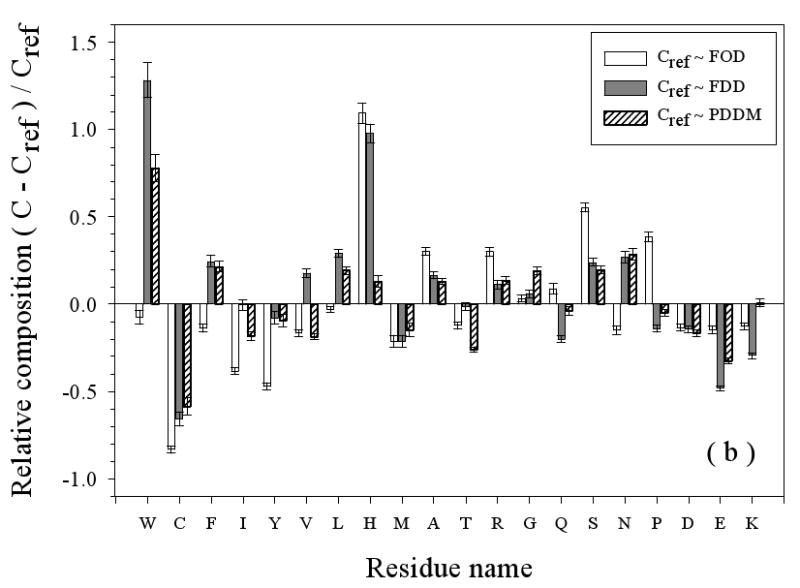
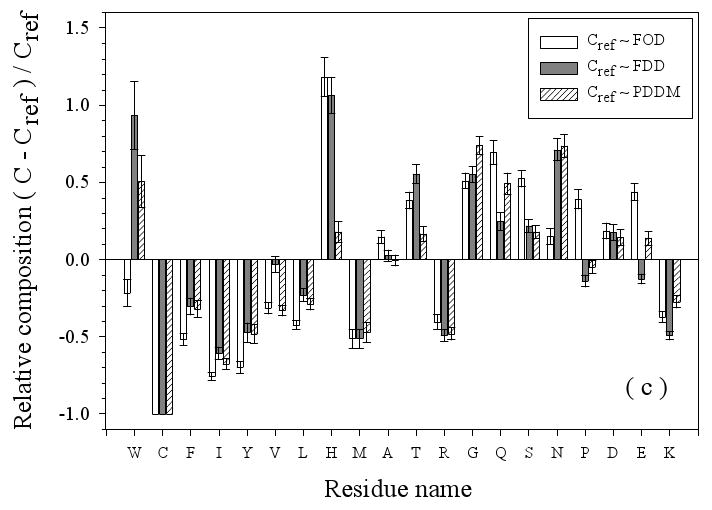
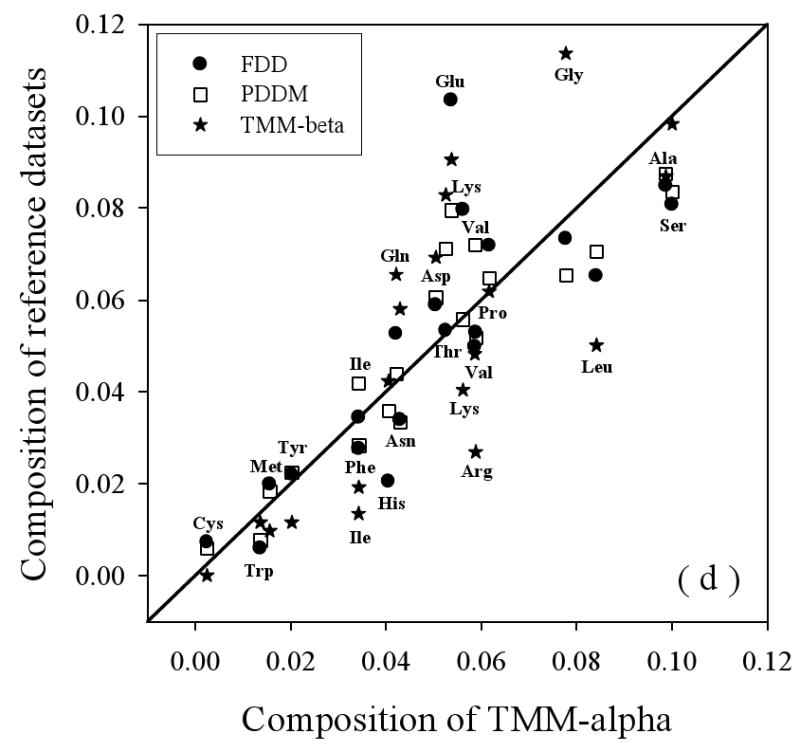
Amino Acid Composition Profiles: Profiles are calculated as (CX-Cref)/Cref where, CX is the composition ratio of a given type of amino acid in one data set, and Cref is the composition of the same amino acid in the dataset being compared, thus giving the fractional difference for each amino acid for the datasets being compared. The arrangement of the amino acids is from the most structure-promoting on the left to the most disorder-promoting on the right. The profile comparisons were carried out for five datasets, which are the following: 1. the missing regions of helical TM proteins (TMM-alpha): 2. the missing regions of beta TM proteins (TMM-beta); 3. the fully ordered dataset(FOD); 4. the fully disordered dataset(FDD); and 5. the missing regions of the partially disordered dataset(PDDM). These pairwise comparisons are as follows: TMM-alpha = CX versus TMM-beta = Cref (a); TMM-alpha = CX versus (from left to right) FOD (white bars), FDD (black bars), or PDDM (cross-hatched bars) = Cref (b); and TMM-beta = CX versus (from left to right) FOD (white bars), FDD (black bars), or PDDM (crosshatched bars) = Cref (c). Pairwise comparisons of the datasets are given by the alternative method of plotting one set of compositions versus the other set of compositions (d), indicated by the following symbols: FDD versus TMM-alpha (black circles); PDDM versus TMM-alpha (white squares); TMM-beta versus TMM-alpha (black stars). The bold line is the diagonal indicating equal compositions in a given pair of datasets.
