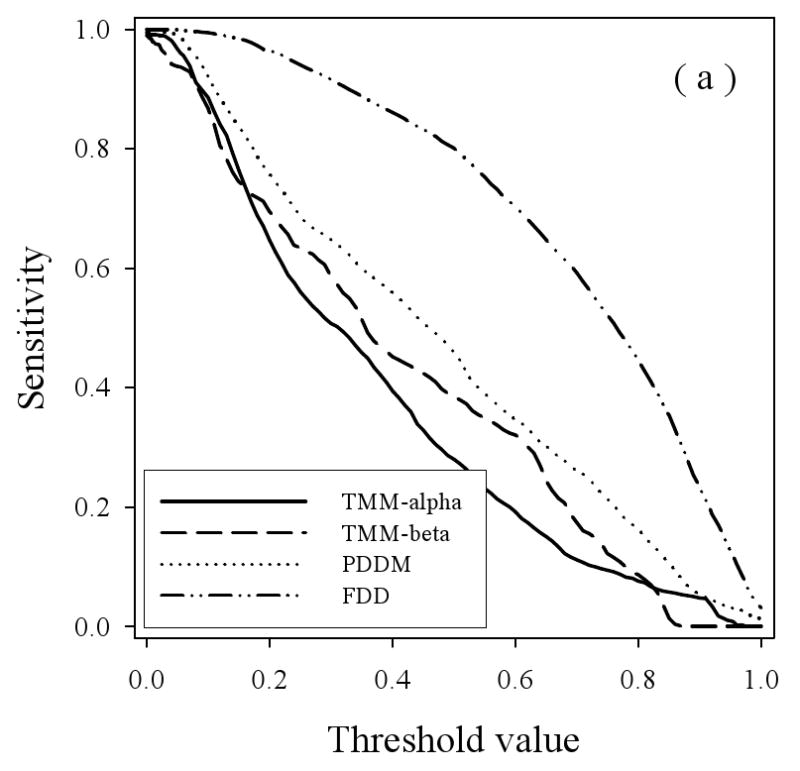
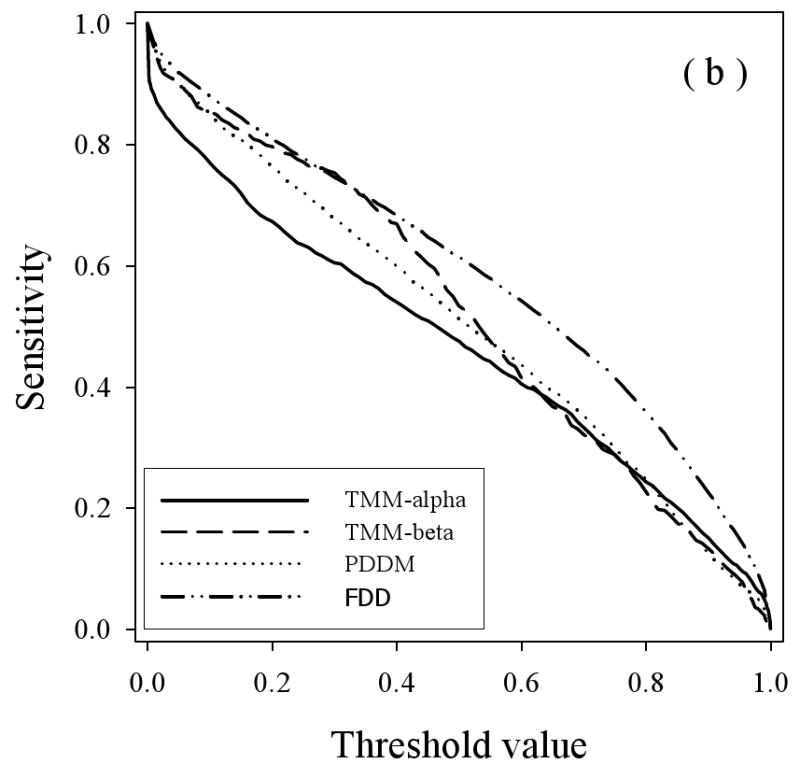
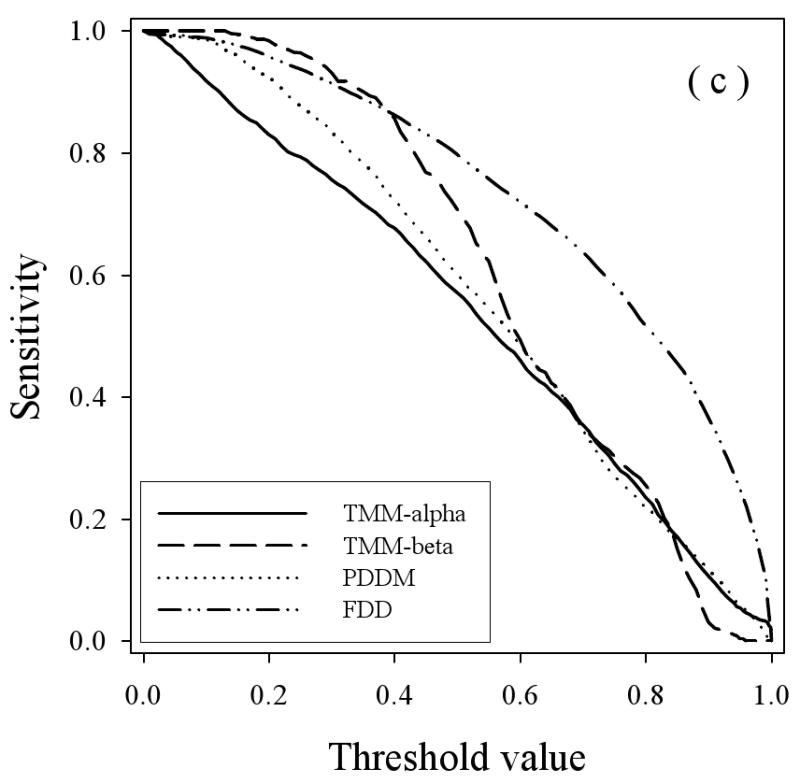
Figure 6.


Specificity versus Threshold: The specificity (false positive) values are plotted versus the threshold values using the three predictors VL3 (a), VLXT (b), and VSL2 (c) where the calculations were carried out for the four datasets: TMM-alpha (solid lines), TMM-beta (dashed lines), PDDM (dotted lines), and FDD (dash-dot-dotted lines).
