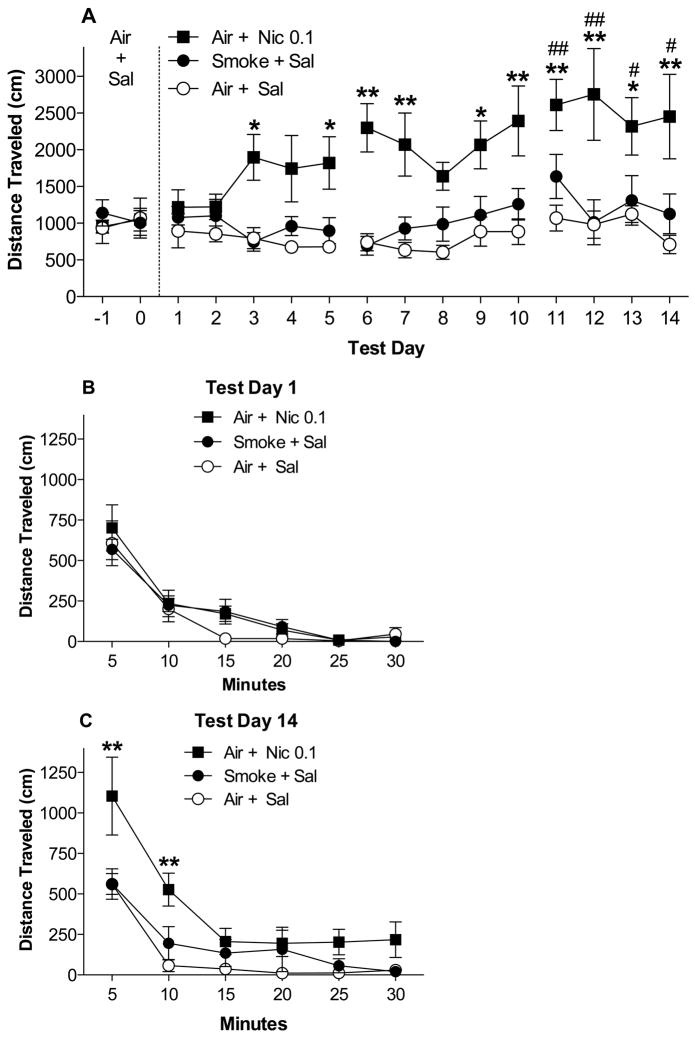
Figure 3.
(A) Total distance traveled (Mean ± SEM) during each 30 min post-exposure test during Habituation and Sensitization (see text). *,** Significantly different from the Air + Sal group (negative control) on that test day, p < 0.05, 0.01. #, ## Significantly different from test day 1 for that group, p < 0.05, 0.01. Total distance traveled (Mean ± SEM) during each 5-min block on the first (B) and final (C) day of Sensitization (test days 1 and 14). ** Significantly different from Air + Sal group at that 5-min block, p < 0.01.

