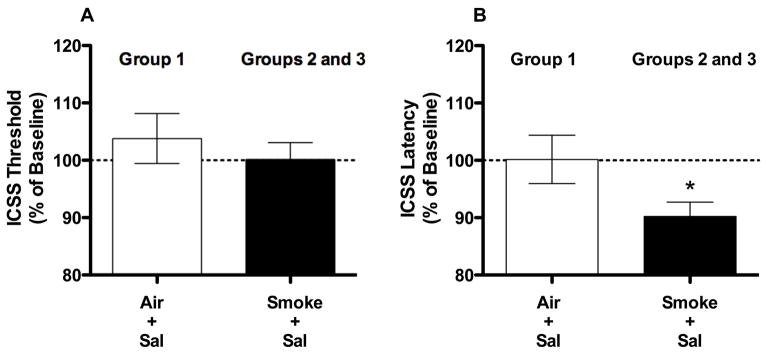
Figure 5.
ICSS thresholds (A) and response latencies (B) on the test day during Phase 1 of Experiment 3 (expressed as percent of baseline, mean ± SEM) following exposure to Air + Sal (Group 1) or Smoke + Sal (Groups 2 and 3, averaged across both groups). * p < 0.05 compared to Air + Sal exposure in Group 1.

