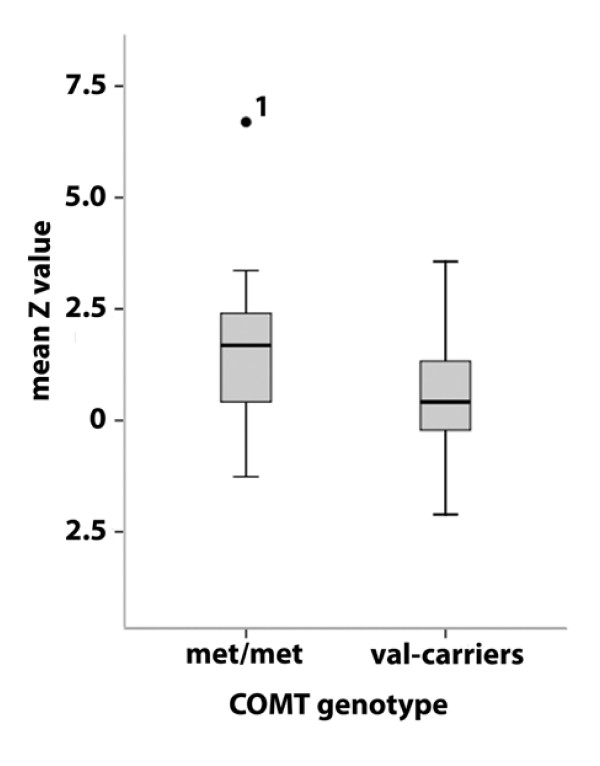
Figure 2.
Boxplot of COMT genotype effect on fMRI BOLD activation in the anterior cingulate cortex (ACC). Median, 25th percentile, 75th percentile, minimum value, maximum value and outliers are shown. 1 The high BOLD activation in response to laser stimulation in this subject was reproduced in a second experiment that was performed two month later (mean Z value in the ACC = 5.3), suggesting that this 'outlier' is reflecting biological variance in the sample and not a measurement error. Furthermore, the genotype effect on ACC activation remained significant, (F = 7.06; p = 0.01; F = 4.92; p = 0.031 age-corrected) even when this subject was excluded from the analysis.

