
Figure 3.
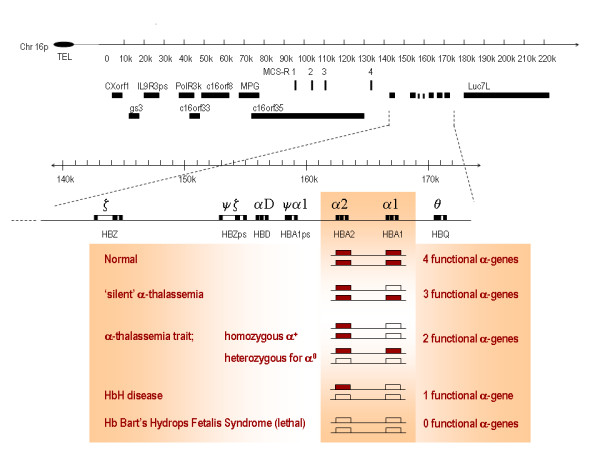
The structure of the α-globin gene cluster on chromosome 16. The telomere is shown as an oval, genes in the region are shown as boxes. The α-globin regulatory region (MCS-R 1 to 4) is indicated as vertical bars. The scale is in kilobases as indicated above. The alpha-gene cluster is enlarged showing the traditional gene names above and the HGVS gene names below. The table below shows the classification of gene defects and phenotypic expression.