
Figure 5.
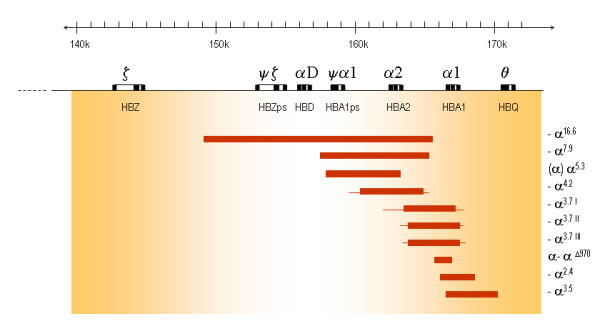
Deletions of one α-gene giving rise to α+-thalassaemia. The extent of the deletion is shown as bars, thin lines indicate regions of uncertainty of the breakpoints.
Official websites use .gov
A
.gov website belongs to an official
government organization in the United States.
Secure .gov websites use HTTPS
A lock (
) or https:// means you've safely
connected to the .gov website. Share sensitive
information only on official, secure websites.
Deletions of one α-gene giving rise to α+-thalassaemia. The extent of the deletion is shown as bars, thin lines indicate regions of uncertainty of the breakpoints.